At the ESFA we have been conducting research with providers focusing on how they submit data to us and where improvements can be made. We looked at what transpires before and after submission of the ILR returns.
Admittedly the learner data submitted by a provider is quite complex and the plot thickens with each ILR (Individualised Learner Record) return. AFED was created to empower FE providers with a deeper insight into their submitted learner data. The groundwork was laid by conducting frequent yet detailed user research sessions, considering the provider feedback which is vital for each successful release.
Data takes resource
We found that the sheer volume of data can pose a big burden for providers; the managing, collecting, submission and understanding of it all. There are several reports provided after submitting an ILR return to help providers, but these can be overwhelming in their differences and format.
Another finding was how large and small providers differ in what resources they can allocate to the task of data management and resolution of any data errors. Whole teams, with bespoke systems, exist in educational settings with larger providers, while smaller providers struggle to satisfy the data reporting requirements.
What is clear for both, is that a significant amount of time and money is spent on the process of data management and reporting.
Giving providers more
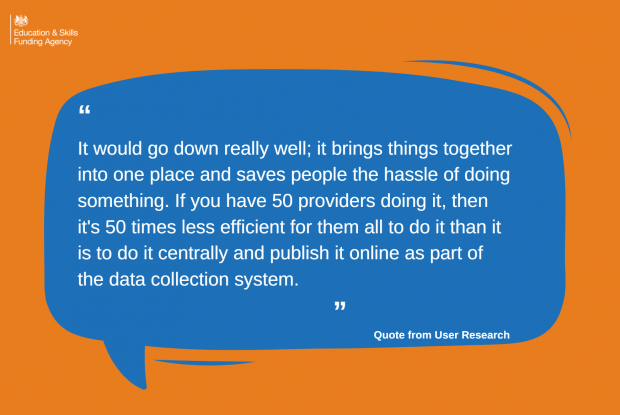
As we collect data from all further education providers, we have information that would be beneficial to share with the sector to help others understand their position.
This could be through giving reliable financial projections based on achievement rates, a sector average for a certain type of provider or how close a provider is to becoming at risk in specific categories.
These are what providers have asked for and want to see. The idea being that they can be proactive, instead of reacting to errors after submitting a return or being financially penalised.
A design based on evidence
This information could be given to providers in a format that is designed based on user feedback. This allows us to produce a tool that is relevant and meaningful to the people that use it, rather than what we assume you want or need.
Over the past few months, we have been working on a data reporting tool that will show your position after every submitted ILR return. It will be broken down into 5 sections comprising learner, funding, benchmarking, quality, and compliance. These areas were identified in the research as being the most important.
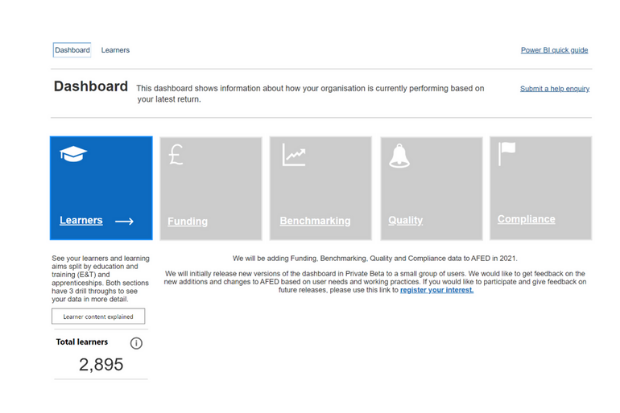
With each new development we make, we release it to a ‘private beta’ group. This is a group of providers working with us to give feedback. This small group enables us to develop, test, release, and respond quickly to changes that need to be made.
View your education data
The tool will be released on view your education data (VYED). You will need an Identity and Access Management System (IDAMS) account to get access to the tool. Once in VYED, you will also need to request the ‘View Your Education Data – AFED’ role.
There is no limit on who can have access from one’s educational setting. Ideally, we would want anyone who finds it helpful to have access to it. Each setting’s allocated ‘super user’ may need to give others access once the tool is available.
The tool: Analyse FE Data (AFED)
We have built AFED using Microsoft’s Power BI software, some of you may be familiar with Power BI from using the QAR reports on VYED.
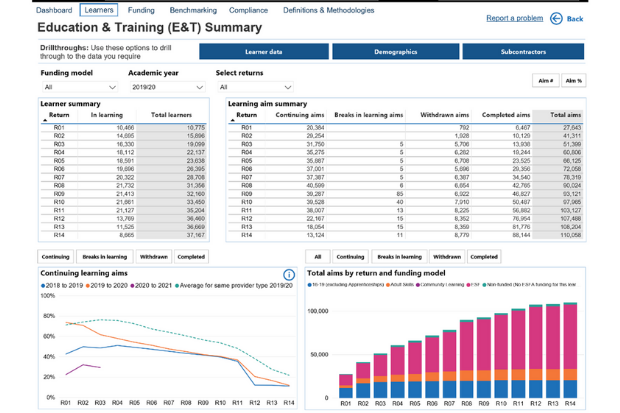
This release focusses on learner data, with future releases including additional sections. The section is split into education and training (E&T) and apprenticeships for simplicity. You will be able to see learner numbers categorised by their status of learning, as well as the aims by status.
You can filter the data by funding models, 3 years’ worth of data and individual return periods. We have been able to show an average against providers of the same type, meaning that you can get an idea of how others are performing.
There are 3 ‘drill throughs’, so sections that show your data in more detail. The sections are learners (individual aims), demographics and subcontractors. Each section can be filtered, enabling you to tailor the data to your needs.
Every visual and section of data can be exported from Power BI by hovering over the element and selecting the 3 dots to see ‘export’.
Individual aims drill through
Four tiles will show the number of aims by status from the latest return and show a comparison against the previous return.
A large table of all your aims is made up of several categories, allowing you to see what is relevant to you and refine using the filter. Again, it will show 3 years’ worth of data and can be filtered by one, or many, returns.
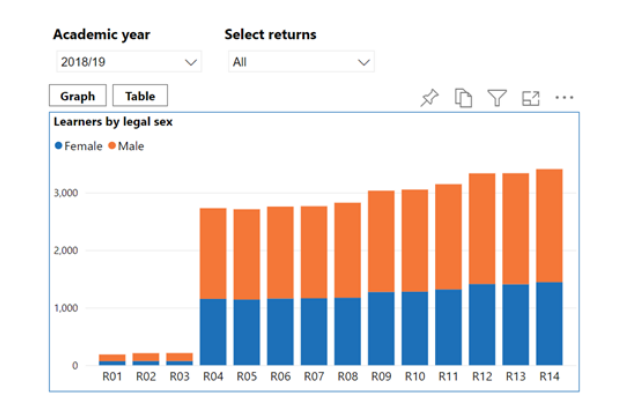
Demographics drill through
There are 3 visuals, legal sex, learning difficulty and health problems, and ethnicity, all of which can be viewed as a graph or table. Each is split up by return to show your performance through the academic year.
Subcontractors
This will only apply to those providers who contract out some of their learning to subcontractors. It will be blank if it does not apply to you.
The first table shows your learners, while the second table details your subcontractors. A simple way to see all aims for one subcontractor, is to use the right-mouse button on the subcontractor you want and select ‘drill through’.
Guidance
The tool will contain a quick guide of how to use Power BI, if you are new to the functions, and guidance on elements within the tool. There will also be definitions for terms we have used.
Where possible, we have tried to retain familiar terms, and their meaning, used within the sector. Again, relying on user research to inform our choice of language.
Give us feedback
The link ‘submit a help enquiry’ (within the tool) will act as a place for you to tell us something isn’t working or to ask for guidance.
1 comment
Comment by Richard Graham posted on
Interesting post. If you are asking anyone to submit data to you, the quality of the data will depend on what the submitter is going to get in return. Case in point being the course data submitted to the ESFA by Providers - if you make this data available to innovators via API, you will increase exposure to Providers courses and the data they submit will improve.